Last week I posted about the Office UI Fabric recently released for developers creating Office 365 / Office / SharePoint applications or add-ins. In that post I mentioned a sample app that I created to manage a fantasy football draft. This consisted of an Excel task pane add-in that I used to issue draft picks on my laptop & a single page application built with Angular that was shown on my TV to everyone in the draft.
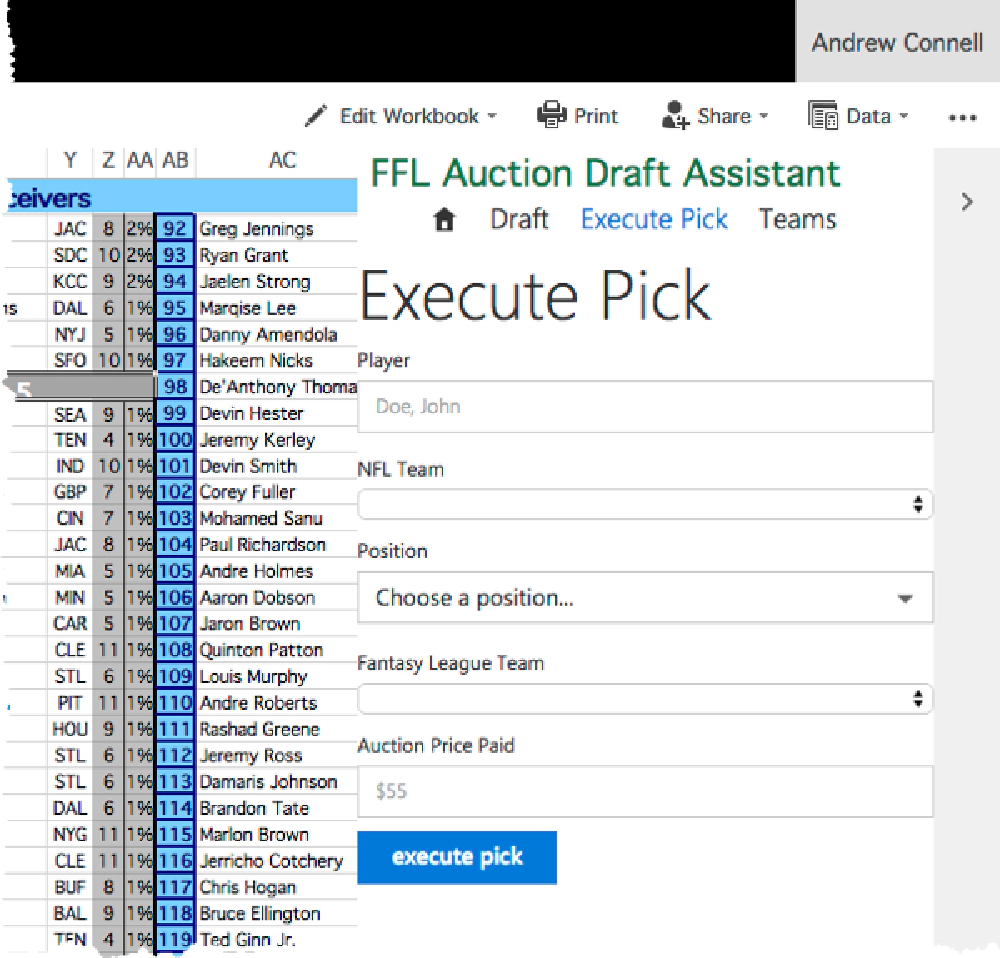
Office UI Fabric - AddIn
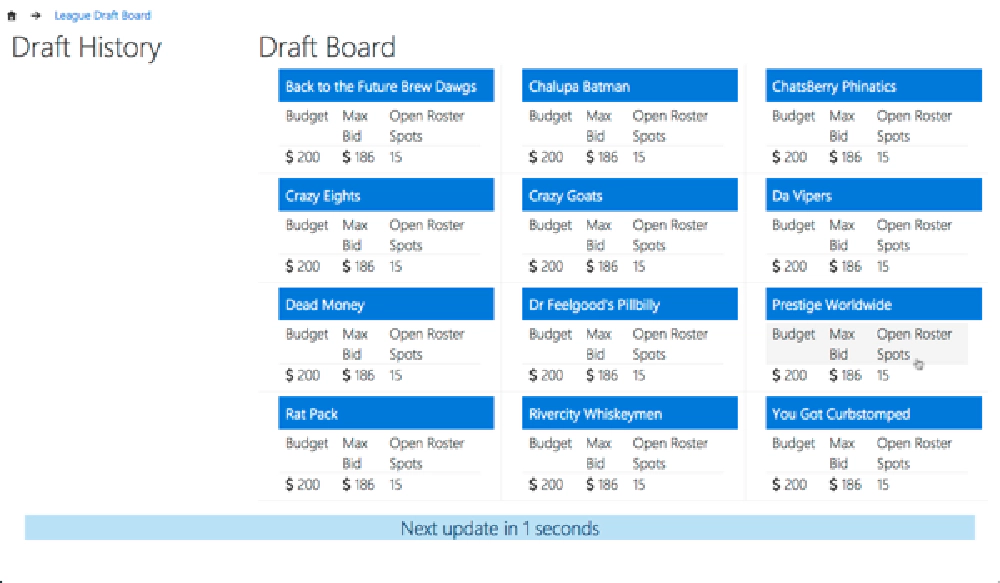
Office UI Fabric - Draft Board
Right before our draft I was wondering if how many people would actually use the draft board on their devices so I thought “why not add some analytics to it!” Not a great idea with just 45 minutes before people started showing up, but what the heck.
I had looked at Azure’s Application Insights (App Insights) a bit in the past and always wanted to try it out, so I gave it a shot. In the past I had used Google Analytics with some custom scripts to get this same thing accomplished. The effort to set up & implement App Insights within my two apps was comparable to Google Analytics (GA). However where App Insights shined was in the reports.
I’ve only ever used GA to measure client-side interactions with my applications, never anything with server side stuff. However App Insights is made to handle both the serve side & client side.
Check out a recent post by Paul Schaeflein about using App Insights on how he used it to figure out an issue with an existing app: Using Application Insights & Performance Monitor to Troubleshoot Environment Errors.
For this app I only used the client-side piece because these two apps were 99% client side apps. They both talked to a REST API written using Node.js that just did read/write operations against a static JSON file (I know… ghetto development but this was a “just get the damn thing working as fast as possible” type app).
Adding App Insights to a SPA
Both of my applications, the Excel task pane add-in & the full-page web app on the TV were both built using Angular so the instructions for each was pretty straight forward.
Getting it set up on both apps was quite simple and easy. You can follow the instructions on the Azure documentation Application Insights for JavaScript Web Apps. In those instructions you create an App Insights resource within your Azure subscription. In my case it was already created for the Azure Web App that hosted both apps & the Node.js REST API. In that process they give you some code to paste into your site. Here’s what mine looks like:
If you can’t see the code you are likely reading this in an offline or RSS reader. Code chunks like above are embedded using public Gists that are only rendered in a full browser so jump to the post on my site to see the full code snippets.
Notice that my code commented out the last line. That’s because this is a single page app - there’s no such thing as a page other than the first one. Everything is really a collection of screens.
Now what I wanted to do was to capture the screen they were on as well as events each user performed within the application. You can do this with custom page views and custom events. These are well explained in the Application Insights API for Custom Events & Metrics page on Azure.
What I did was to create an Angular service to handle these things for me.
Notice within this snippet, within both methods trackPageView & trackEvent, that I’ve set up a config object that will be passed to App Insights. Each method collects some data and sends it to the App Insights service using two simple commands:
Calling the App Insights API
To track a custom page view you call:
appInsights.trackPageView(pageName, url, configData);
To track a custom event you call:
appInsights.trackEvent(event, configData);
The object appInsights is a globally defined object that’s added when you added the script in the first snippet above to the page.
Now the task was to simply call these methods in this service within my application!
Let’s look at the code for the Excel task pane add-in, specifically logging the page view and the action of recording a pick. First I define the controller and tell Angular to inject my service:
angular.module('appng-ffldraft-xlsaddin')
       .controller('draftPickController',
                   ['$location',
                    '$routeParams',
                    'dataService',
                    'azAppInsightService',
                    draftPickController]
                  );
function draftPickController($location,
                             $routeParams,
                             dataService,
                             azAppInsightService) {
    ...
  init();
}
Within the controller’s init() function, we call the track page view function in my service:
function init() {
  // track page view
  azAppInsightService.trackPageView('draft-pick',
                                    '/league/:leagueId/draftpick,
                                    $routeParams.leagueid,
                                    null);
}
That’s it! In addition, this controller’s view model has a function that records a draft pick. It first calls my data service to actually save the pick, but when that complets, it then logs the custom event:
And that’s it… see how easy it is to record a custom page view and a custom event? I can even pass in some custom data to each item.
Reviewing the App Insights Reports
Now is where the real fun comes in! The App Insights documentation on the Azure website has some good walk throughs and explanations on working with the data they provide, but allow me to show you some of my reports. So, keep in mind that there were 12 people in the draft and four people did their entire draft from magazines & paper… the other 8 of us used laptops/tablets/phones to research. In addition, the draft lasted from about 3p - 6:30p so when you look at these graphs, if the numbers look low, it’s because it was a lower usage than most web apps.
The following chart shows data on the number of page views:
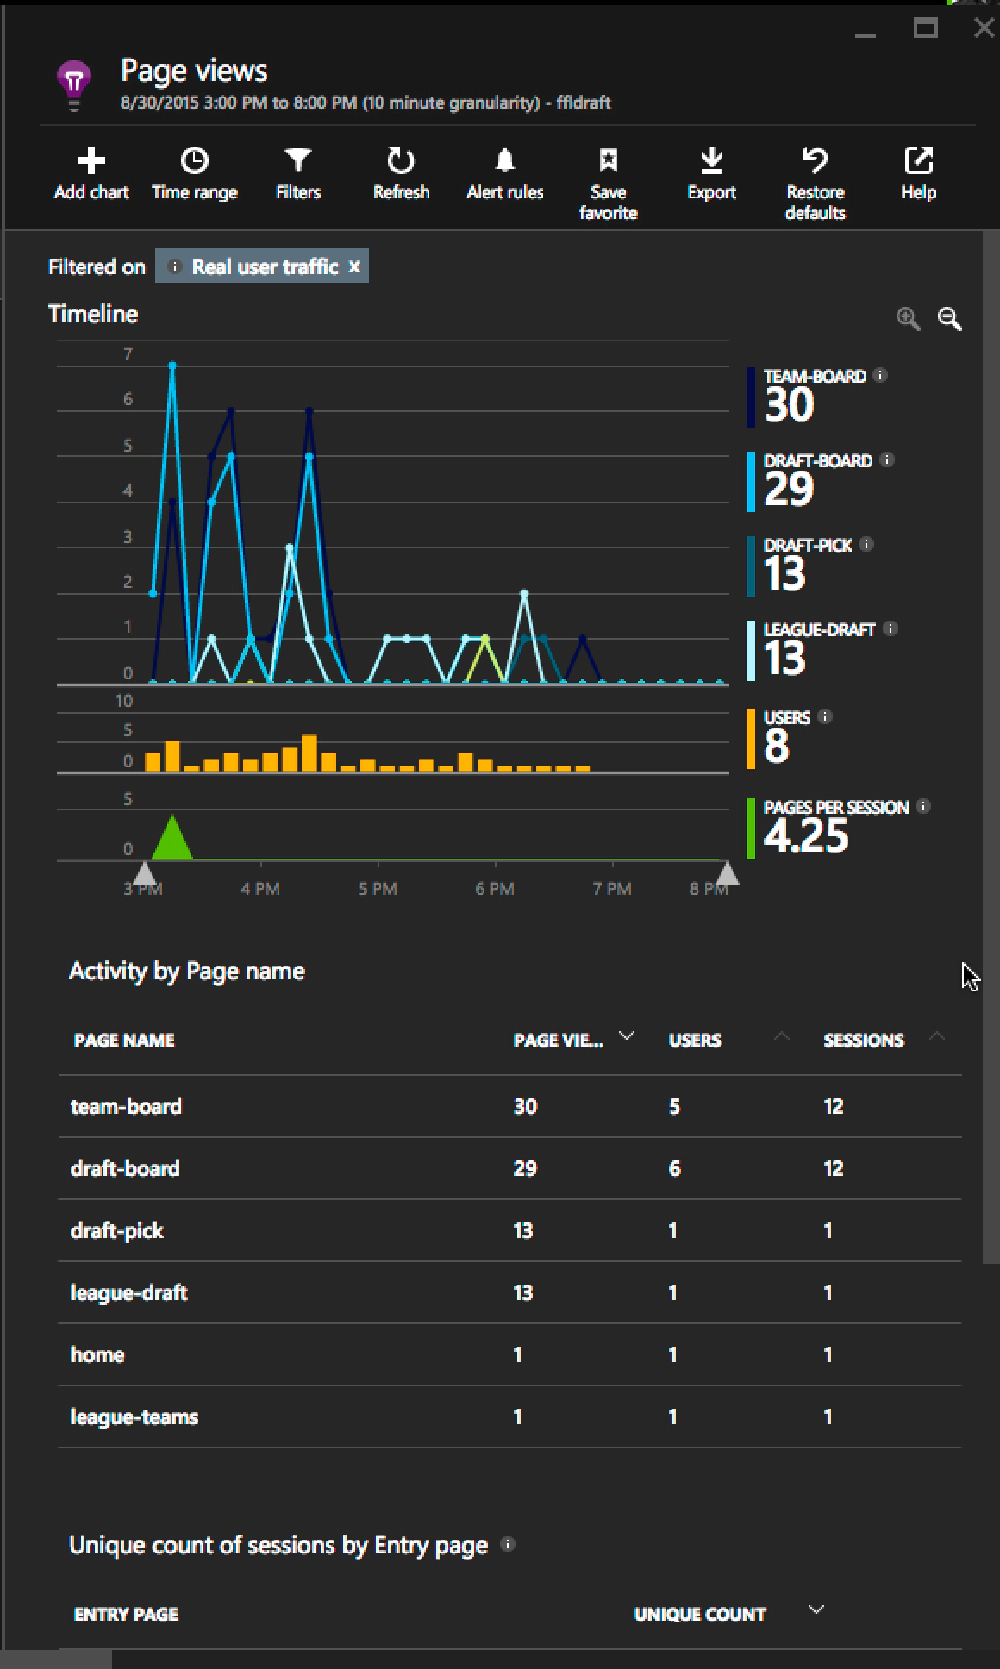
Page Views
The following chart shows data on the number of users:
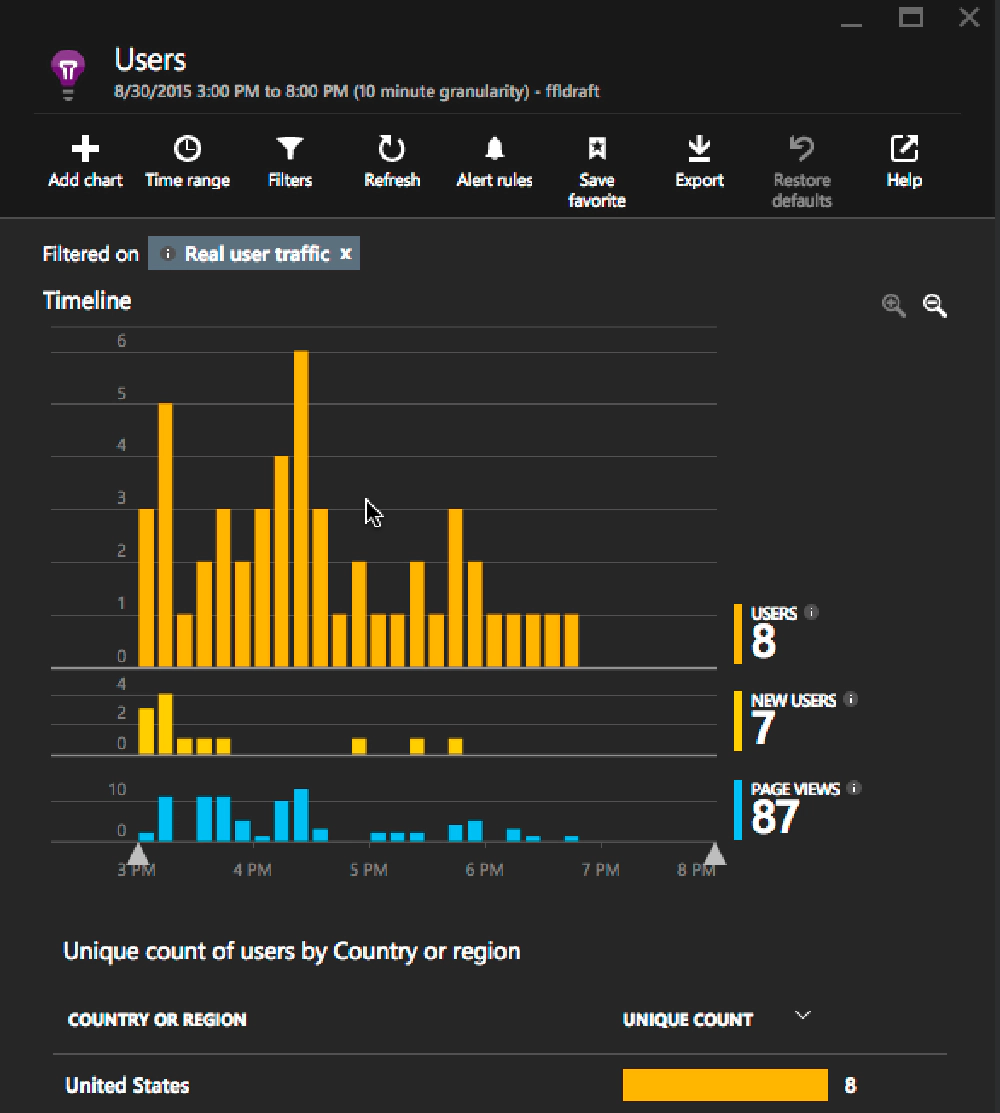
User Activity
This graph showed information related to the session activity among these 8 users with a nice breakdown in the the operating system that was used.
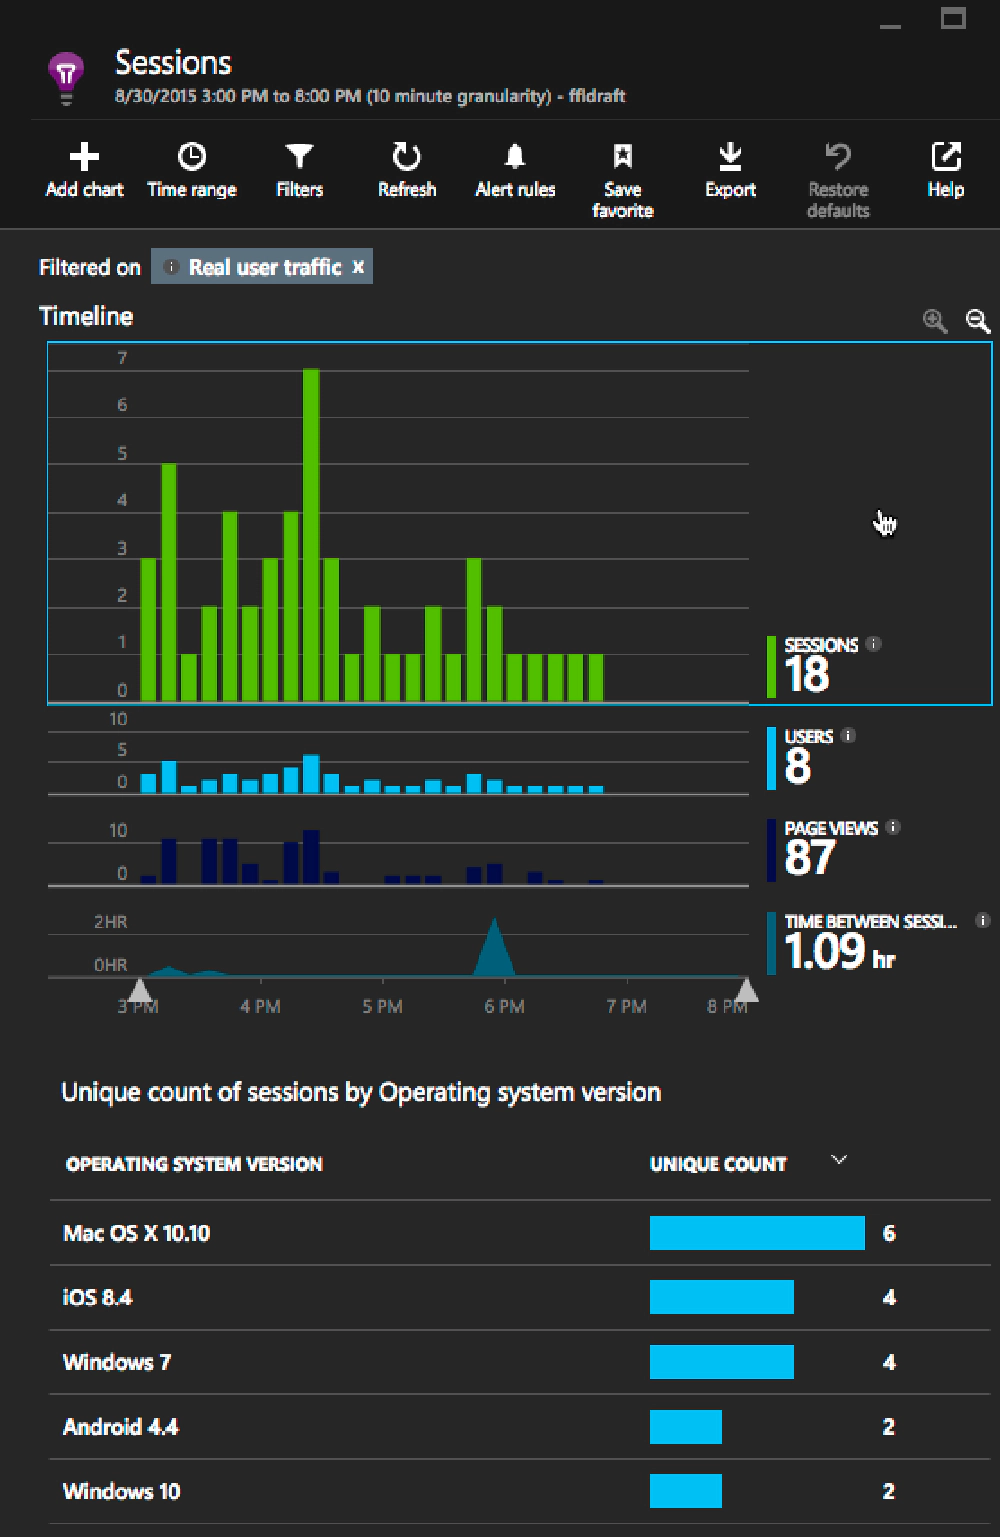
User Session Activity
Selecting some of the different metrics at the bottom would refocus the chart filter, which you can see just below the control buttons at the top of the chart below. This one shows the real time traffic from people who were on OSX:
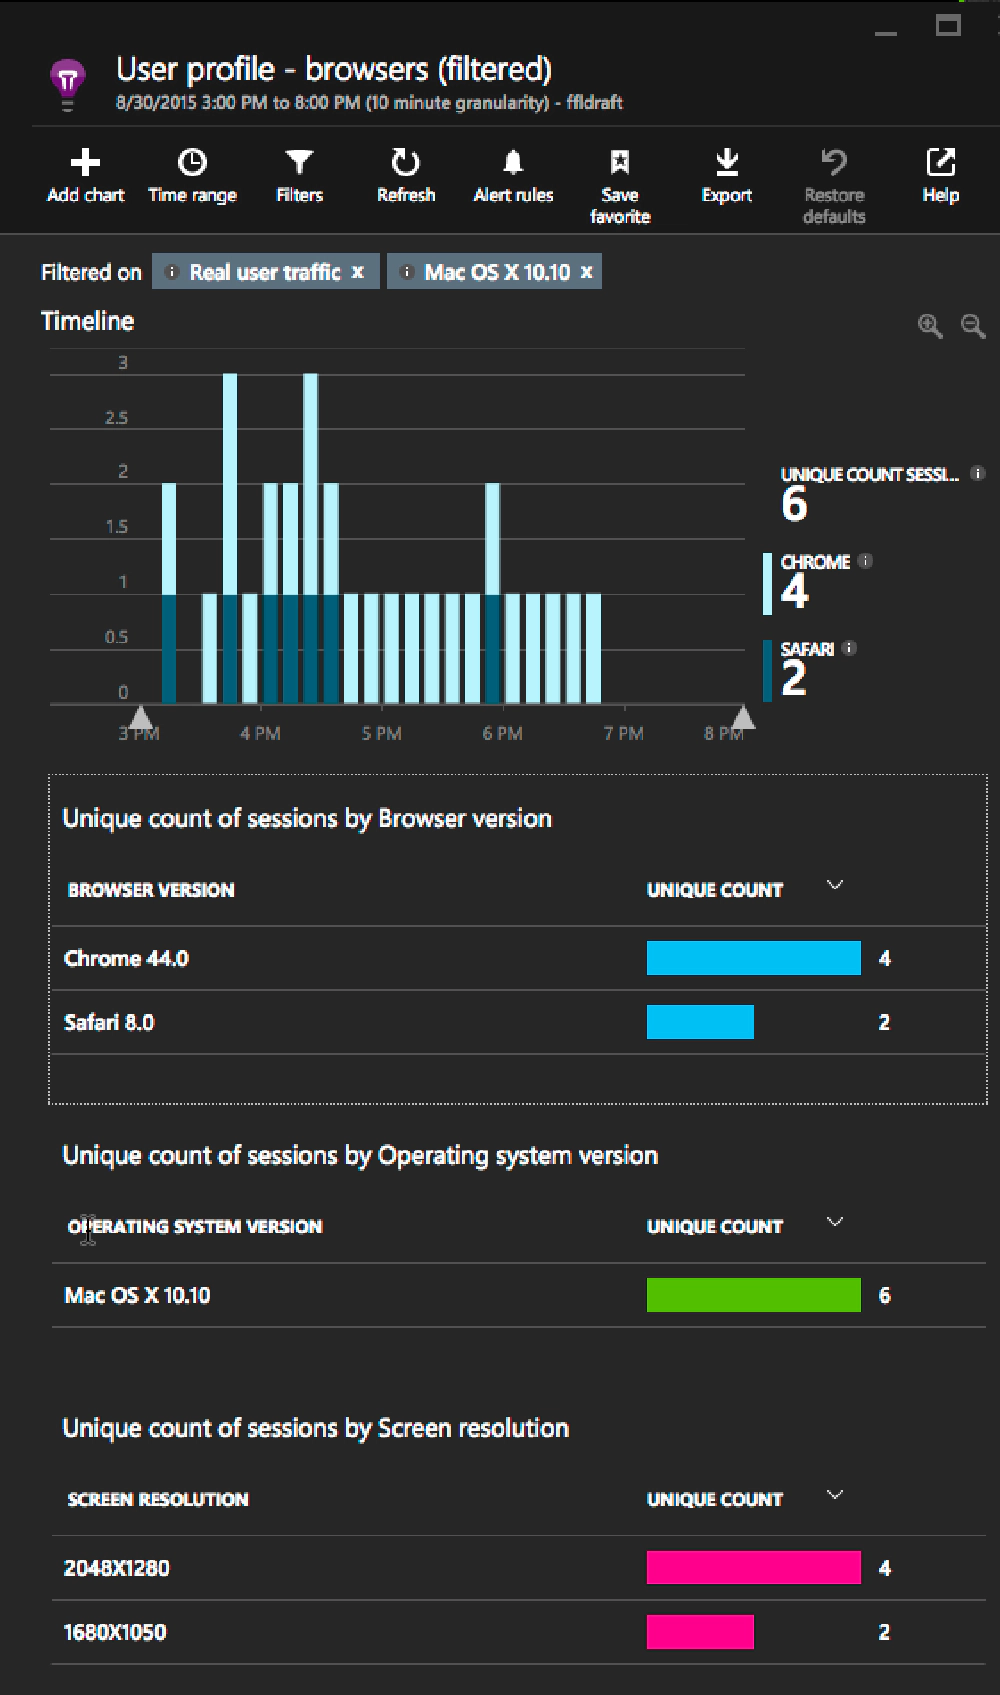
Browsers by OSX
Interesting… but check this one out. Here I selected the users who were using the Chrome browser. A blade opened to the right showing all the activity by that browser type. Notice how it’s showing a history of the page views & events?
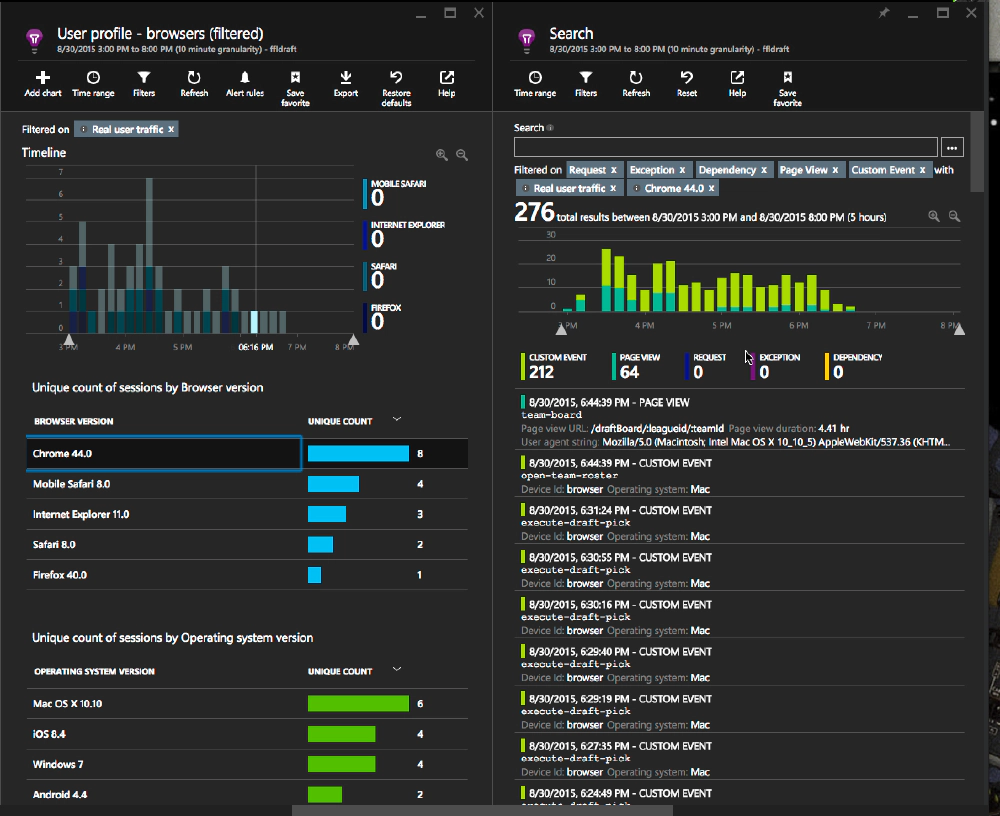
Activity Drill Down Browser
Taking that previous chart, if I click on a specific page view, I can see the custom data that was saved with that page view I recorded:
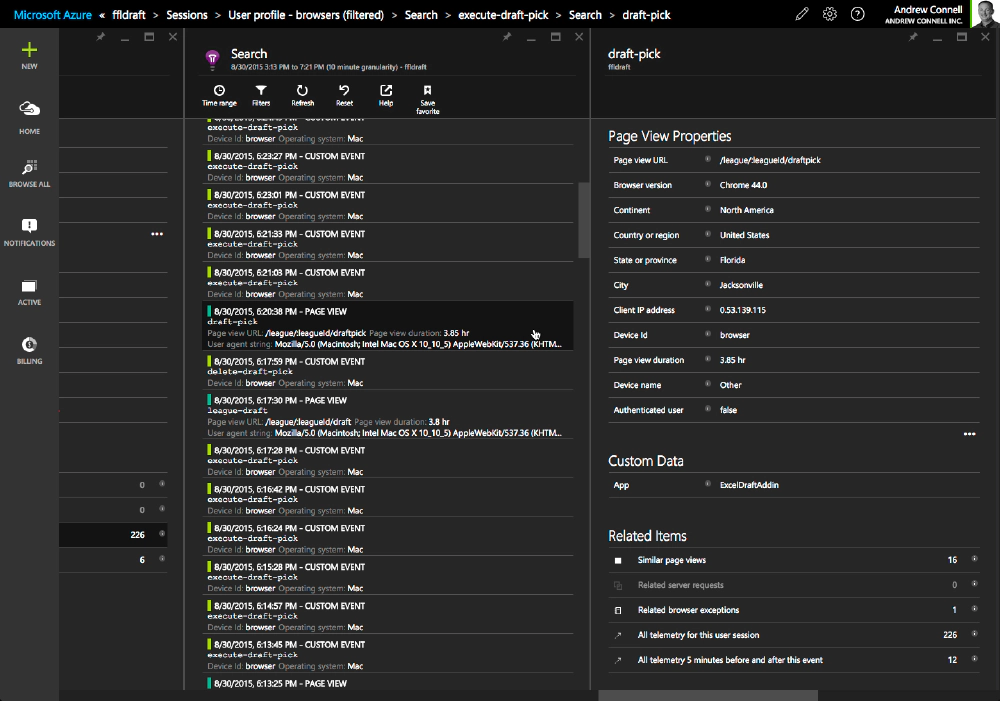
Filter by UserSession/PageView
And if I click on an event, I can see the same sort of detail… in this case the actual player that was drafted at that time:
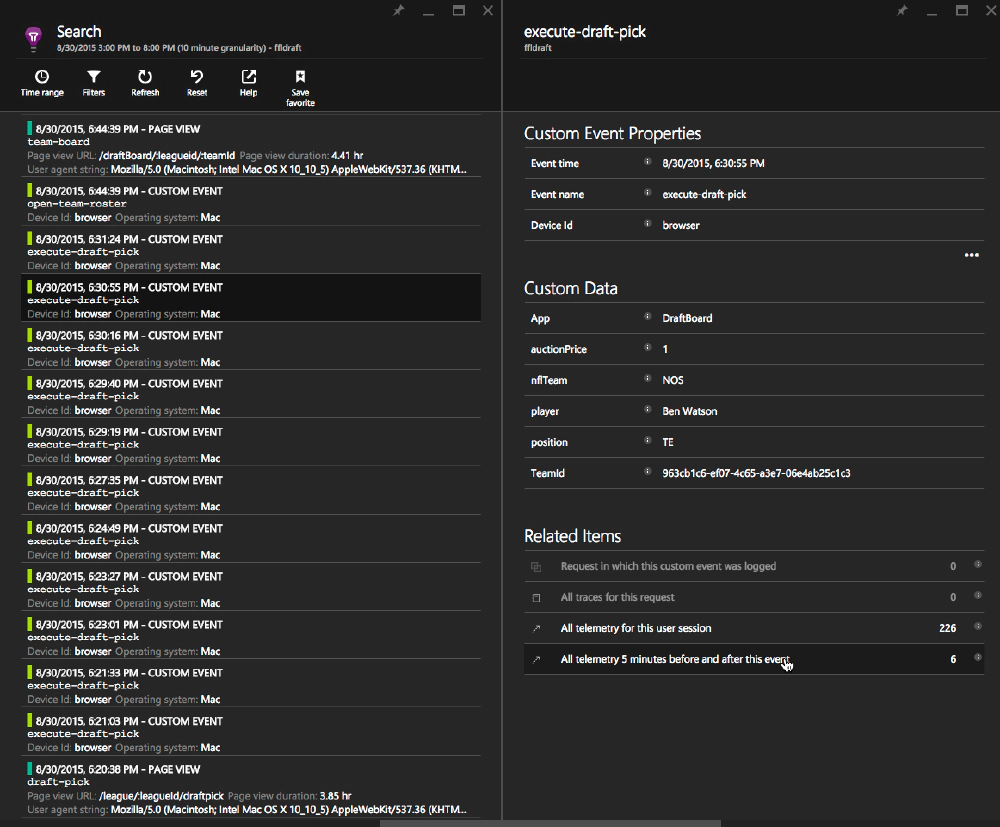
Filter by UserSession/Events
How can you use all this data? There’s an interesting scenario walk through on the page Azure App Insights - Usage analysis for web applications with Application Insights, specifically the section on Custom Events where they walk through a scenario for an app where they see a lot of users abandon their games (a custom event). So they drill into specific events and find that there’s a scenario where users are frequently logging in to simply check the latest scores and then leaves because there is no leader board for the app. Using this data, you could add a leader board making your users happier and giving you better data on how they are playing the web based game.
App Insights Pricing
The pricing model of App Insights is quite nice too. You can, for free, collect data from an unlimited number of devices, hosts and sessions per month and other data up to 5M data points per month. Other data includes things like custom events, dependencies, exceptions, custom metrics, page loads, page views, request, performance counters & trace data. In addition, you have access to all the raw data for the last 7 days and aggregate data over the last 13 months.
For just $24.50/mo you can get unlimited aggregate data, raw data for the last 15 days, up to 15M other data points (with the option to buy more at $1.75/M) and the ability to configure continuous export of your data to an Azure storage blob where you could then configure something like Power BI to slice and dice your data even more.
Bump that up to $99/mo and you can keep raw data for up to 30 days & 50M data points
You can get the full pricing details here: Application Insights Pricing